
Understanding Metastatic Breast Cancer Clinical Trials
A clinical trial is a study that every treatment must go through before it is reviewed by the Food and Drug Administration, or the FDA. The FDA looks for 2 main things in each clinical trial—efficacy and safety. Efficacy means how well a treatment works in fighting the disease and/or its symptoms. Safety looks at any side effects and other risks a treatment may have. The FDA weighs the balance between efficacy and safety when deciding whether or not to approve treatments.


How is a clinical trial set up?
A treatment may be studied in many different clinical trials. The FDA looks at 1 or more of these trials to approve a treatment. Patients who are part of a trial are randomly divided into groups or arms. One group of patients, called the experimental arm, is given the treatment that is being tested. The other group of patients is called the comparator or control arm.
In clinical trials for metastatic or Stage 4 breast cancer, the treatment used in the comparator arm depends on the study design. Typically, the patients in the comparator arm are given the current standard treatment that is available for their cancer. Sometimes, patients in the comparator arm are given a placebo. Another option is called treatment of physician's choice, where a doctor may choose to give the patients in the comparator arm the treatment normally used in his or her practice.
Experimental Arm


Endpoints: Efficacy and Safety
Comparator Arm


Every clinical trial studies a treatment using certain endpoints. These are specific criteria used to measure the benefits of a treatment. Different endpoints are used for different types of diseases, but many clinical trials for metastatic breast cancer use the same ones. Depending on the goals of the trial, researchers will decide if an endpoint is a primary endpoint or a secondary endpoint. Successfully achieving the primary endpoint is ordinarily the most important factor for the FDA to determine whether or not a treatment should be approved.

How are endpoints evaluated?
Overall survival is one endpoint that shows how much longer life is prolonged by treatment. The FDA considers overall survival to be the “most reliable” endpoint for determining a treatment’s advantage, and the preferred result in clinical trials for cancer. Progression-free survival is how much time passes before the tumor grows or the cancer symptoms get worse. These endpoints usually compare the median results of the trial, meaning that there can be a range of results for the treatment.
Both overall survival and progression-free survival may be shown using a graph called a Kaplan-Meier or K-M curve. A K-M curve compares how many patients live (or do not experience worsening symptoms) over a period of time in one group versus the other.
For illustrative purposes only.
Does not represent actual data.
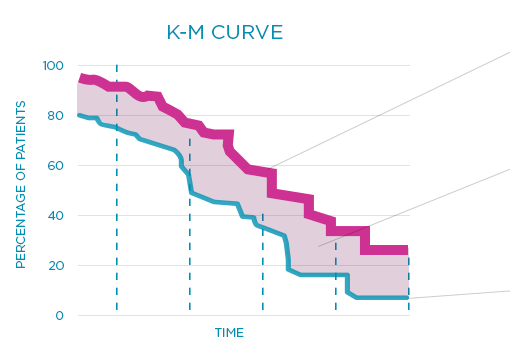
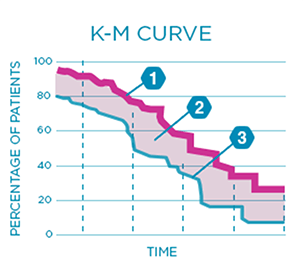
Experimental arm This line shows what percentage of patients are still living or what percentage have not had worsening cancer symptoms
Area between the curves The bigger the space between the curves, the greater the difference in survival rates
Comparator arm This line shows what percentage of patients are still living or what percentage have not had worsening cancer symptoms
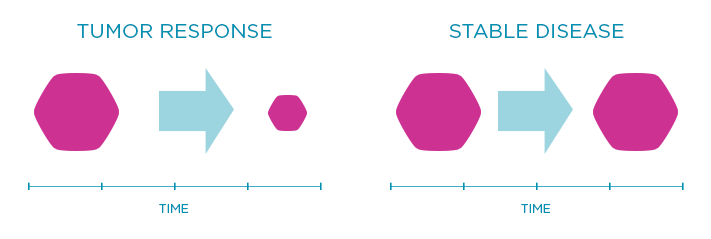
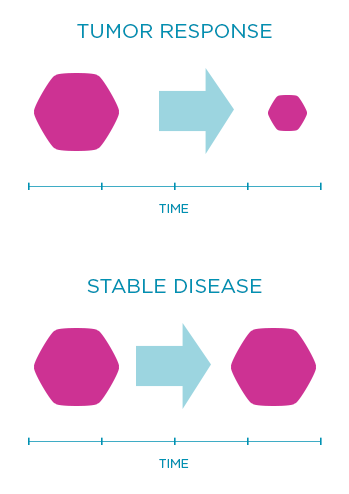
Response rate is another endpoint that shows the percentage of patients whose tumor shrinks or disappears after treatment. Sometimes doctors also look at the rate of stable disease, which is when the tumor neither shrinks nor grows nor spreads over a certain period of time.
For illustrative purposes only.
Does not represent actual data.
Knowing more about what endpoints were used in a treatment’s clinical trials can help you
and your doctor better understand how well the treatment may help fight your disease.